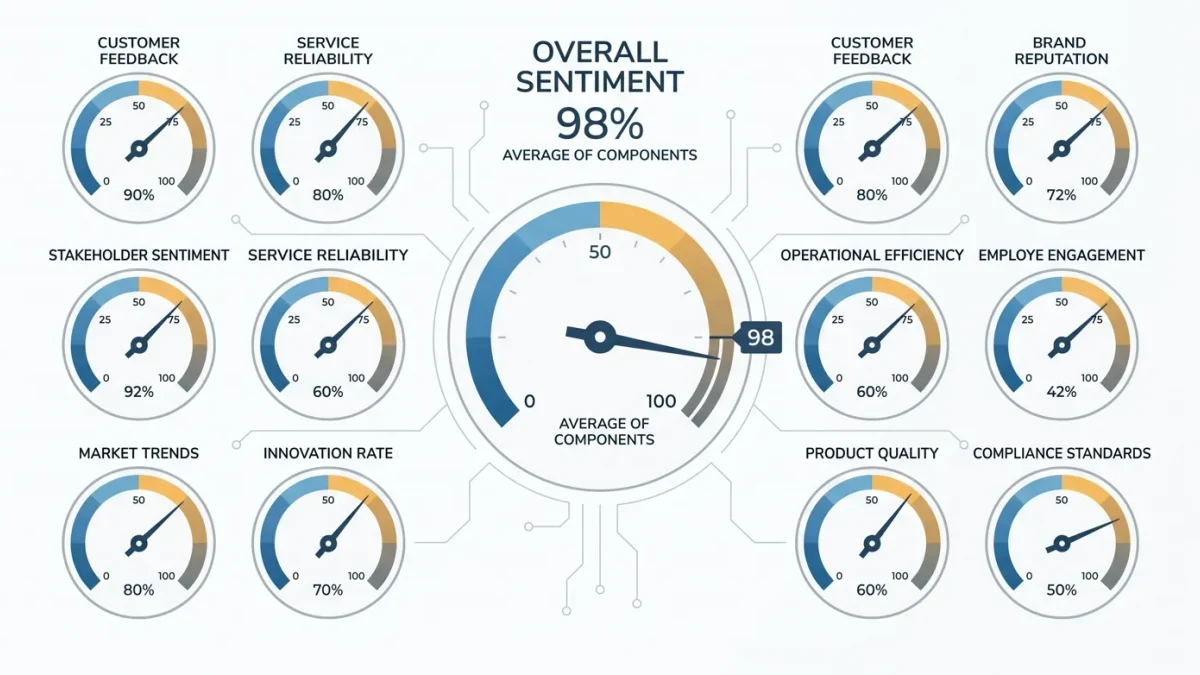
The NFIB Small Business Optimism Index is a monthly reading built from ten survey components answered by members of the National Federation of Independent Business — employment plans, openings, inventory and capital spending plans, sales and credit expectations, earnings trends, and views on whether it is a good time to expand — averaged into a single number against a decades-long baseline of roughly 98. It is the most frequently cited small business indicator in financial news, and it earns that place with coverage length: the series dates to 1973, long enough to span five recessions and to make "versus its historical average" a meaningful comparison rather than trivia. This article explains what the index is, what it is not, and how to read its moving parts.
Business News 7 publishes information, not economic advice; sentiment surveys describe conditions, not outcomes for any business.
What Are the Ten Components?
Each month NFIB surveys a sample of its membership across industries and states, asking questions whose net responses — percent planning positively minus percent planning negatively — form the components: plans to increase employment, plans to make capital outlays, plans to add inventory, expectations of the economy improving, expectations of real sales rising, whether it is a good time to expand, current job openings, positions not able to fill, expected credit conditions, and earnings trends versus the past three months. The index averages the seasonally adjusted components and indexes them against its 1986 base of 100. Two things follow from the construction. First, it is a plan-and-perception survey, not a measurement of revenue or employment — it captures what owners intend and expect. Second, the population is NFIB's membership of independent small businesses, which skews smaller than the economy's whole small-business universe; it is a very good thermometer for Main Street, not a census of it.
Which Components Lead and Which Lag?
The components move on different clocks, and the useful reading separates them. Expectations components — whether owners expect the economy to improve and whether it is a good time to expand — are the volatile, forward-looking ones that swing with news and credit conditions, and historically they turn before the headline index does. Earnings trends and sales expectations are coincident-to-lagging: they describe pressure already absorbed. Hiring plans and unfilled openings track the labor market's tightness, which in recent years has been the most persistent component regardless of the cycle. Credit expectations respond to financing conditions with a lag. An index rising on expansion expectations signals improving animal spirits; an index holding up only on unfilled openings while earnings components sag describes a strained-but-functioning Main Street — different stories that the same headline number can hide.
How Should a Business Owner Use It?
Three practical uses fit a monthly ten-minute read. As timing context: optimism troughs historically coincide with better moments to negotiate leases, hire, and buy equipment, because everyone else is cautious; peaks do the reverse. As validation: when the survey's reported problems — labor quality, inflation, taxes — match your own cost stack, that is confirmation your pressure is systemic rather than a management failure. As a filter on headlines: single-month moves of a point or less are noise; the meaningful signals are sustained gaps from the 98 baseline and turns in the expectations components. Owners should also pair it with the SBA and Census releases on formation and survival, which measure behavior rather than sentiment, for a two-sided picture.
What Are the Known Criticisms?
Fair ones, stated plainly: the survey reflects an advocacy organization's membership rather than a random sample of all small firms; sentiment indices can diverge from hard data for extended periods — optimism can lag actual improvement as owners wait to believe it; and the composite's design smooths away the component detail that carries the information. None of this makes the index useless; it makes it an input to read carefully rather than a verdict. The lesson: the index is Main Street's mood measured the same way for five decades — most valuable in its components, its distance from baseline, and its direction, and least valuable as a single month's number in a headline.