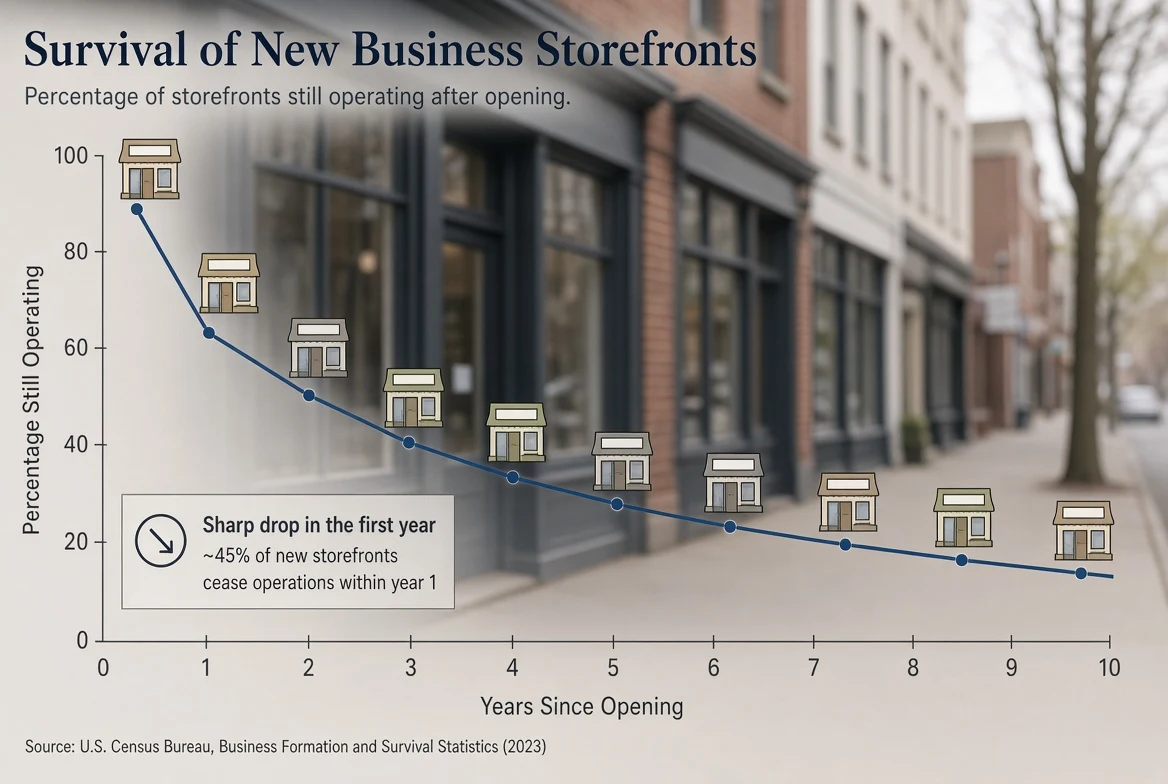
About half of new American businesses are still open five years after they start. Of the private-sector establishments that opened in March 2013, 79.6 percent were still operating a year later, 50.6 percent were still operating at the five-year mark in March 2018, and 34.7 percent were still trading in March 2023, according to Bureau of Labor Statistics tracking data.
That curve is the single most useful number a first-time founder can carry into year one, and it is routinely mangled. It is not the widely repeated claim that nine in ten businesses fail. It is not a promise either. It is a measured attrition rate for a cohort of real establishments, tracked one year at a time by a federal statistical agency, and it has looked broadly the same for three decades.
What share of new businesses actually survive five years?
Roughly half. The Bureau of Labor Statistics survival table follows each birth cohort of private-sector establishments from its opening quarter forward, reporting how many are still operating at each anniversary. For the March 2013 cohort, survival since birth ran 79.6 percent at one year, 50.6 percent at five years and 34.7 percent at ten.
Two things follow from that shape. The steepest single drop happens in the first twelve months, when roughly one establishment in five closes. After that the curve flattens: the business that clears year one is statistically a different proposition from the business that opened last quarter.
The agency also publishes a second rate alongside it — survival of the previous year's survivors — which measures the annual hazard rather than the cumulative one. That distinction matters, because a founder in year four is not facing the same odds as a founder in month four.
Has the survival curve changed over time?
Not dramatically. The BLS charts cohorts by opening year from 1994 through 2015 and finds that survival follows a similar path regardless of birth year. Measured a year after opening, the 1994 cohort stood at 79.6 percent, the 2000 cohort at 78.4 percent and the 2008 cohort — the businesses that opened directly into the financial crisis — at 75.2 percent.
A few points of difference in a downturn is not nothing, but it is smaller than the folklore suggests. Macroeconomic timing shifted the first-year number by about four percentage points for the worst-timed cohort in the series. The longer tail is where the real erosion happens: the 1994 cohort was down to 19.5 percent twenty-two years after opening, and the 2000 cohort to 26.3 percent by year seventeen.
Survival rates also vary by industry, which the BLS reports separately. A national average is a blend of sectors with very different capital requirements, lease obligations and customer-acquisition costs, and no founder operates in the average.
How big is the population these rates describe?
Very large, which is why small differences in the rate translate into enormous absolute numbers. The SBA Office of Advocacy counted 33,185,550 small businesses in the United States, or 99.9 percent of American businesses, employing 61.7 million people — 46.4 percent of private-sector employees.
Those firms paid 39.4 percent of private-sector payroll and generated 32.6 percent of known export value, the agency reported. Between 1995 and 2021 they created 17.3 million net new jobs, 62.7 percent of net jobs created over that period.
Set against a population that size, a five-year survival rate near 50 percent describes millions of closures and millions of survivors simultaneously. Both halves of that sentence are true, and most retellings of the statistic keep only the half that suits the argument.
What does business formation data add?
It captures the front end of the funnel that survival rates measure at the back. The Census Bureau's Business Formation Statistics provide what the bureau describes as timely, high-frequency information on new business applications and formations in the United States, built with economists from the Federal Reserve Board, the Federal Reserve Bank of Atlanta, the University of Maryland and the University of Notre Dame.
Applications and survival are separate measurements of separate things. A quarter of heavy application volume tells a founder about the competitive environment they are entering; the survival table tells them what happens to the entrants several years later. Reading either one alone produces a distorted picture of how crowded or how forgiving a market is.
What the numbers can and cannot tell a founder
They describe a population, not a business. Survival statistics are a base rate: the starting point before anything specific about a company — its margins, its concentration of customers, its founder's prior operating experience — is taken into account. They cannot forecast a single outcome, and no cohort rate should be read as a prediction about any one venture.
What they usefully correct is the framing. The commonly cited idea that the overwhelming majority of new businesses vanish quickly is not what the federal series shows; the first year is the dangerous one, and the curve then flattens into a long, slow decline. Planning cash runway around a brutal first twelve months, rather than around a mythical universal failure rate, is closer to what the record supports.
Decisions about financing, leases or hiring turn on facts specific to a business, and the survival table is not a substitute for them.
The lesson the data actually supports is narrow and worth stating plainly: the first year carries the largest share of the risk, and clearing it changes the odds materially. Everything after that is a slower attrition that rewards businesses able to keep operating rather than businesses that opened at a lucky moment.