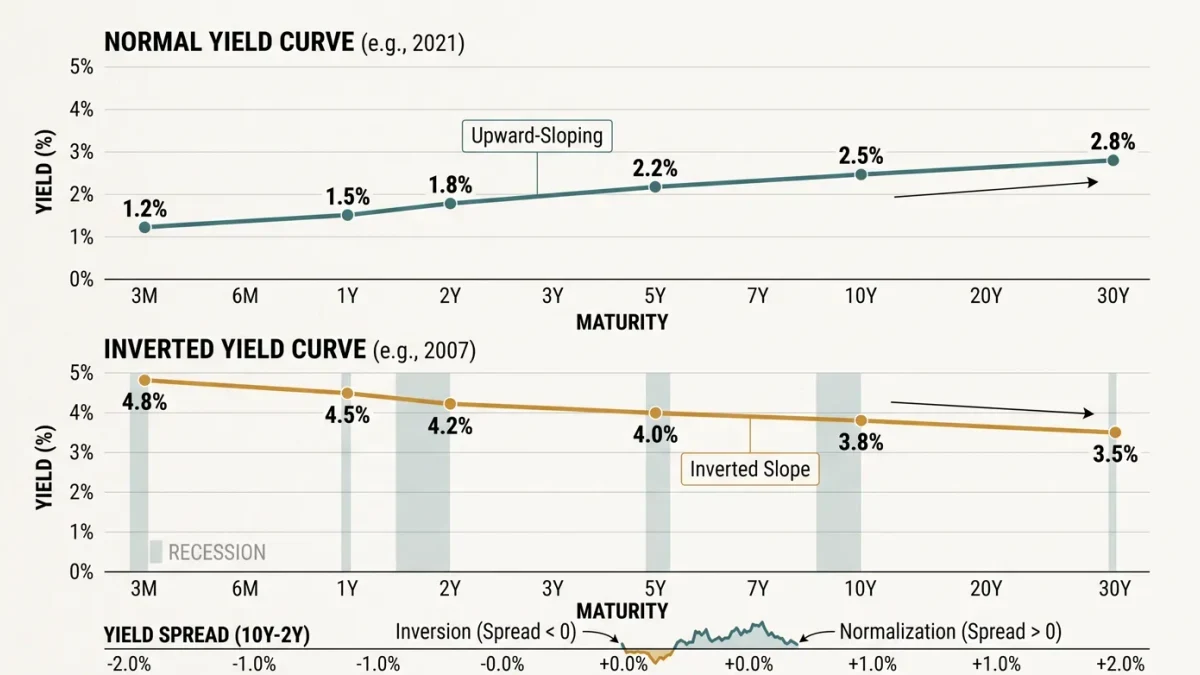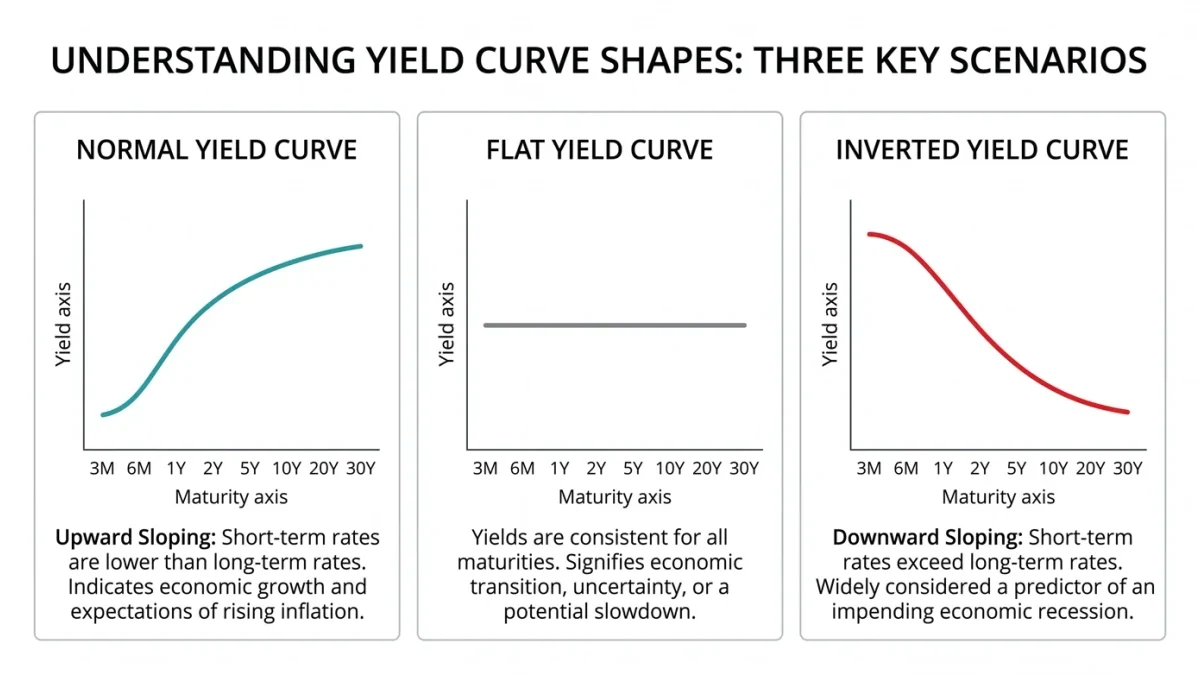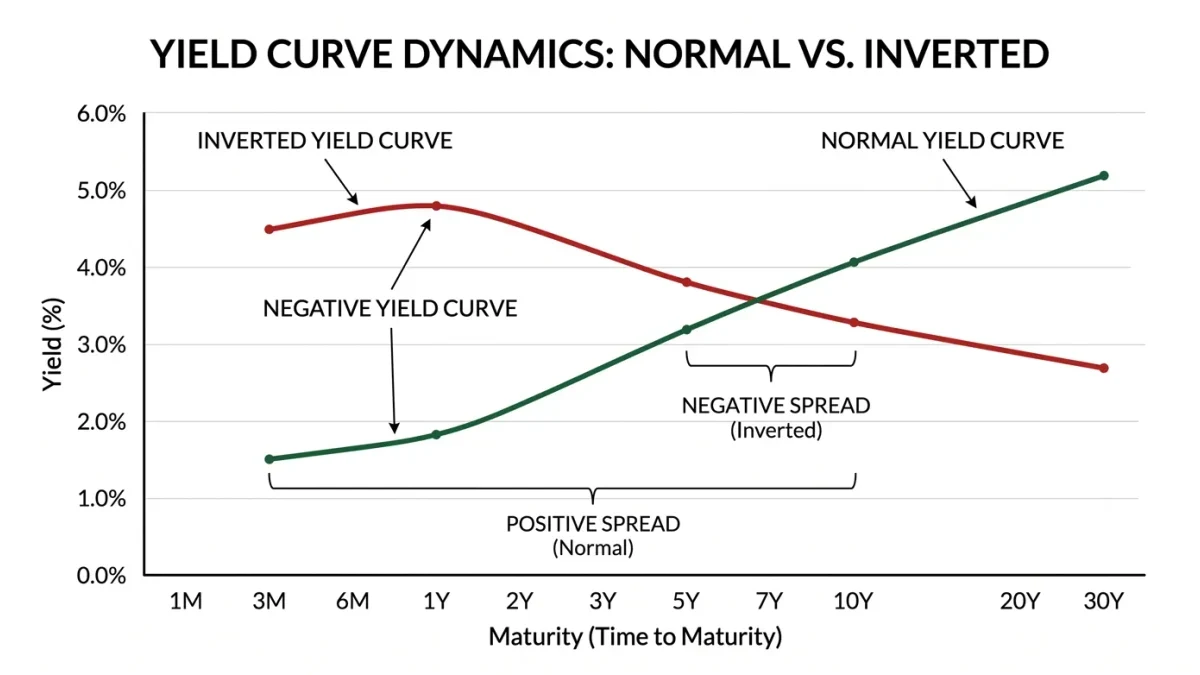
The yield curve — the line connecting Treasury yields from three months to thirty years — tells small business owners what lenders collectively expect interest rates to do, because the same expectations price your credit line, your equipment loan, and your landlord's mortgage. In its normal shape, long yields sit above short ones, compensating lenders for time. When it inverts — short yields above long — the market is pricing rate cuts ahead, historically often ahead of recessions; the 2022-2024 inversion was among the longest on record before normalizing. Reading the curve takes ten minutes on Treasury Department data and turns rate news from noise into planning input. This article explains the mechanics and the practical uses.
What Is the Curve Actually Showing?
Each Treasury yield is the market-clearing price for lending to the U.S. government for a specific term. Short yields track the Federal Reserve's policy rate almost mechanically; long yields embed expectations of average future short rates plus a term premium. The two-year yield, in particular, is a running forecast of where the Fed's rate will sit over the next two years — when traders expect cuts, the two-year falls before the Fed moves. The spread between ten-year and three-month or two-year Treasuries is the summary statistic financial press references: positive means normal, negative means inverted. None of this requires forecasting skill to use; it requires only reading what traders have already priced.
Why Should a Business Owner Care?
Because the curve transmits into loan pricing with a lag measured in days. Floating-rate credit — cards, lines of credit indexed to prime or SOFR — reprices with the Fed's short end. Fixed-term borrowing — equipment loans, SBA debt, commercial mortgages — prices off longer yields. When the curve steepens with short rates falling, floating costs drop while fixed costs hold: the sequencing argues for converting floating balances to fixed, or for timing a capital purchase. When short rates rise while long holds — a flattening — floating debt gets expensive fast, which is the environment that catches overextended borrowers. An owner who watches the two-year yield and the ten-year minus three-month spread roughly once a month knows which of these regimes they are in.
What Does an Inversion Actually Predict?
The curve's most famous signal — inversion preceding recessions — has a real but imprecise record: inversions have preceded most post-war U.S. recessions, with lead times from months to over a year, and with false positives in the mix. For planning purposes, the useful interpretation is not "recession coming" but "the market expects meaningfully lower rates within a couple of years." A small business reads that as: a window to prepare — refinancing candidates identified, floating exposure sized, expansion decisions sequenced — rather than a forecast to trade on. The 2022-2024 experience taught the complementary lesson: the inversion's duration and depth told borrowers that cuts would eventually come, and businesses that planned their 2024-2025 financing around that expectation priced better than those reacting to each headline.
How to Build the Ten-Minute Monthly Habit
The routine fits on an index card. Pull the Treasury par yield curve rates, published daily by the U.S. Department of the Treasury, once a month. Note the three-month, two-year, and ten-year yields; compute the ten-year minus three-month spread and its direction of change since last month. Pair that with your debt schedule: every balance, its index or fixed rate, and its maturity. The output is a one-line decision each month — convert, hold, or prepay — made against what the market expects rather than what the news cycle emphasizes. The lesson: the yield curve is free, forward-looking, and directly wired to your borrowing costs — the cheapest strategic input a small business owner will ever ignore.