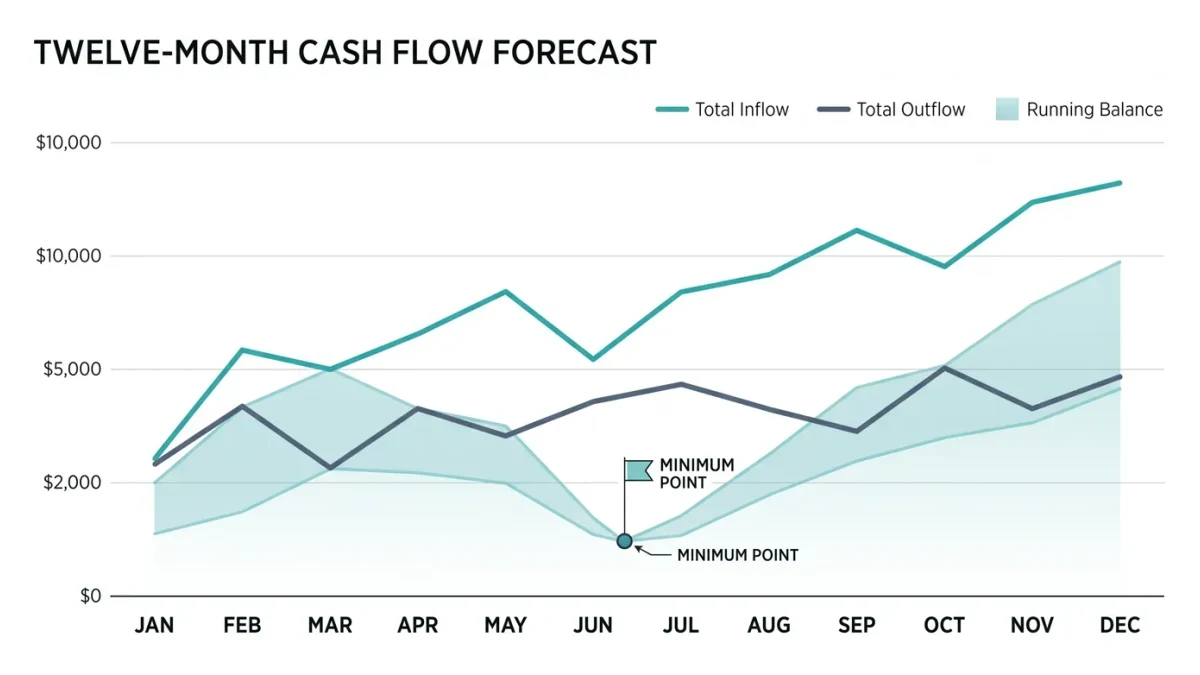
A 12-month cash flow forecast is built from three rows per month — cash in, cash out, and the running bank balance — and its value comes not from accuracy on day one but from weekly correction against reality. Federal Reserve small business research has found that a large share of small firms would struggle to cover an unexpected expense or revenue shock, which is precisely the vulnerability a forecast is designed to surface months in advance. A spreadsheet, an hour to set up, and thirty minutes a week is the entire toolchain. This article walks through the build.
What Goes in the Cash In Row?
Start with actual collections, not invoices: forecast the months in which money reaches the bank. For existing businesses, the most reliable input is last year's collections by month, adjusted for known changes — a gained or lost customer, a price increase, a seasonal pattern expected to repeat. For each entry, note the assumption in a comment ("Customer A renews at $4,000/month through June"), because assumptions are what you will audit later. New businesses without history should forecast conservatively from the pipeline: only deals with a stated decision date and amount, counted at partial probability. Optimism in the cash-in row is the most common way forecasts stop being used — one badly missed month and owners abandon the file.
What Goes in the Cash Out Row?
Group outflows into fixed, variable, and periodic:
- Fixed: rent, loan payments, salaries, insurance — same amount, same date, every month.
- Variable: inventory purchases, subcontractors, shipping — modeled as a percentage of sales where possible.
- Periodic: the budget killers — quarterly taxes, annual insurance renewals, equipment replacement, holiday inventory builds. These belong in the file with exact dates and amounts.
The periodic group is where forecasts earn their keep: a profitable business discovers in the spreadsheet, rather than in the bank statement, that the combination of a quarterly tax payment and an insurance renewal makes one month dangerously thin.
How Do You Read the Running Balance?
The third row is cumulative: prior balance plus cash in minus cash out, month by month. Two features matter. First, the minimum value across the year — if any month shows a negative balance, that is the event to prevent, months before it happens, by moving a purchase, arranging a credit line, or collecting receivables faster. Second, the shape: a forecast that dips below the owner's comfort threshold of operating cash — many owners use one to two months of expenses — flags when to build reserves rather than distribute profits. The balance row turns a profit-and-loss illusion into the truth owners actually live with: profitable companies fail on cash timing constantly.
How Often Should the Forecast Be Updated?
Weekly is the cadence that works: replace the past week's forecast with actuals, shift assumptions that changed, and glance at the next eight weeks. The file then becomes a decision tool — hire now or in six weeks, take the early-payment discount or preserve cash, prepay inventory or not — answered with numbers instead of mood. Monthly, compare forecast to actuals and score the big misses; after two or three quarterly cycles, most owners' forecasts within five to ten percent, which is more than accurate enough to steer by.
What Tools Are Needed?
A spreadsheet suffices for the great majority of small businesses; accounting platforms offer cash flow modules that automate the actuals side and can reduce the weekly work to review. Whichever tool is used, the disciplines are the same: collections not invoices, periodic costs dated precisely, conservative revenue, and a standing weekly appointment. The lesson from every cash crisis story is identical — the information existed beforehand; the forecast is just the discipline of looking at it on purpose.